 Xstreami
- About
- Services
- Blogs
- Careers
- Products
- Contact Schedule a Call


From Arrays to UUIDs: ClickHouse Functions That Will Surprise You!
Unlock the full potential of ClickHouse with these must-know functions. From data transformation to advanced analytics, elevate your database skills today!
Shenbaga Varna S April 07, 2026
Subscribe for email updates

Introduction
Clickhouse Functions Quick-Reference: From addDays to generateUUIDv4
| Function Category | Functions Covered | Use Case |
| Array | arrayMap, groupArray, argMax/argMin | Data transformation |
| Date & Time | addDays(), INTERVAL, toStartOfYear | Time-based analytics |
| UUID | generateUUIDv4(), generateUUIDv7() | Unique ID generation |
| Window | row_number, runningDifference | Trend analysis |
| Aggregate | quantile, stddevPop, sumIf | Statistical analysis |
List of Functions
ClickHouse provides a wealth of functions to work with, each enhancing how you interact with data. Here are some of the most practical functions to streamline your data operations:
- Array Functions
- Array map()
- GroupArray()
- argMax(), argMin()
- Window Functions
- row_number
- runningDifference()
- DateType Functions
- toStartOf [Year/Quater/Month/Day]
- addDays()
- toDateTime()
- Aggregate Functions
- Quantile
- Standard Deviation
- Aggregate Function Combinators
- if
- Array
- Full Text Search
- match()
- UUID Functions
- generate UUIDv4()
- Visual Representation Function
- bar()
- User Defined Function (UDF)
- Executable UDF
- Readable Formatting Function
- formatReadableSize
- formatReadableDecimalSize
- formatReadableQuantity
- formatReadableTimeDelta
Array functions
Array map ()
The arrayMap function in ClickHouse is a powerful tool for transforming arrays. It applies a given expression to each element of an input array, returning a new array with the results.
Syntax:
arrayMap(f, array)
f : The expression or function to apply to each element.
Array: The input array.
clickhouse_node1 :) select arrayMap(x ->(x+1),[1,2,3]) as result ;

Query id: 7972e9a0-5eca-4489-a6ee-efde1fec3bea

    ┌─result──┐
 1. │ [2,3,4] │
    └─────────┘

 1 row in set. Elapsed: 0.003 sec.
In this example, the arrayMap function is used to increment each element in the input array [1, 2, 3] by 1. x -> x + 1 is a lambda function, where each x represents an element in the array.
groupArray()
The groupArray function in ClickHouse is used to create an array of values for each group in a query. It collects the values of a specified column into an array, which can be particularly useful for aggregating data.
Syntax:
groupArray(x) or groupArray(max_size)(x)
x : column or value to be aggregated
max_size : limits the size of the resulting array
Explanation:
- groupArray(actions):
- Aggregates all actions for a user on a specific day into an array.
- Nested Array:
- Using (timestamp, action) pairs ensures the actions are associated with their timestamps.
- arraySort:
- Sorts the array by the timestamp to ensure the actions are in chronological order.
argMax(), argMin()
The argMax function in ClickHouse is an aggregate function that returns the value of a specified expression corresponding to the maximum value of another expression. This is particularly useful for retrieving a related value based on a maximum condition.
Syntax:
argMax(value, order)
argMin(Value,order)
clickhouse_node1 :)SELECT * FROM sale

Query id: 5c408b13-76ed-47ec-ab65-c21ad9fad3ff

   ┌─product───┬─revenue─┬───────date─┐
1. │ Product A │     150 │ 2024-01-10 │
2. │ Product B │     200 │ 2024-01-15 │
3. │ Product A │     300 │ 2024-01-20 │
4. │ Product C │     250 │ 2024-01-22 │
5. │ Product B │     100 │ 2024-01-25 │
   └───────────┴─────────┴────────────┘

5 rows in set. Elapsed: 0.013 sec.
argMax()
clickhouse_node1 :) SELECT
    	argMax(product, revenue) AS highest_price,
  		max(revenue)
		FROM sale

Query id: ea05eab3-3120-44a0-9e74-89689dd412c1

   ┌─highest_price ─┬─max(revenue)─┐
1. │ Product A      │          300 │
   └────────────────┴──────────────┘

1 row in set. Elapsed: 0.027 sec.
argMin()
clickhouse_node1 :) SELECT
    argMin(product, revenue) AS lowest_price,
    min(revenue)
FROM sale

Query id: 3f85880b-e368-4695-aa15-70d2a4298dad

   ┌─lowest_price ─┬─min(revenue)─┐
1. │ Product B     │          100 │
   └───────────────┴──────────────┘

1 row in set. Elapsed: 0.008 sec.
Window Functions:
row_number
The rowNumber function in ClickHouse (and SQL in general) is used for several purposes, primarily related to ranking and ordering data within partitions of a result set.
Syntax:
rowNumber() OVER (PARTITION BY partition_expression ORDER BY
orde_expression )
clickhouse_node1 :) SELECT * FROM player_list

Query id: 4410fb11-d5c4-48f8-bb83-27f870bbb37c

   ┌─team─────┬─player────────┬───salary─┬─position─┐
1. │ Lakers   │ LeBron James  │ 45000000 │ Forward  │
2. │ Lakers   │ Anthony Davis │ 38000000 │ Center   │
3. │ Warriors │ Stephen Curry │ 48000000 │ Guard    │
4. │ Warriors │ Klay Thompson │ 38000000 │ Guard    │
5. │ Nets     │ Kevin Durant  │ 42000000 │ Forward  │
6. │ Nets     │ Kyrie Irving  │ 37000000 │ Guard    │
7. │ Heat     │ Jimmy Butler  │ 40000000 │ Forward  │
8. │ Heat     │ Bam Adebayo   │ 32000000 │ Center   │
   └──────────┴───────────────┴──────────┴──────────┘

8 rows in set. Elapsed: 0.001 sec.

clickhouse_node1 :) SELECT
    player,
    salary,
    row_number() OVER (ORDER BY salary DESC) AS top_salaries
FROM player_list
LIMIT 5

Query id: cafa4ce3-c11b-4621-9d35-9648c82f93cf

   ┌─player────────┬───salary─┬─top_salaries─┐
1. │ Stephen Curry │ 48000000 │            1 │
2. │ LeBron James  │ 45000000 │            2 │
3. │ Kevin Durant  │ 42000000 │            3 │
4. │ Jimmy Butler  │ 40000000 │            4 │
5. │ Anthony Davis │ 38000000 │            5 │
   └───────────────┴──────────┴──────────────┘

5 rows in set. Elapsed: 0.001 sec.
runningDifference()
The runningDifference function in ClickHouse calculates the difference between the current value and the previous value in a specified column. This function is particularly useful for analyzing trends over time, such as changes in sales, stock prices, or other numerical data.
Syntax:
runningDifference(value)
clickhouse_node1 :) SELECT * FROM stock_prices

Query id: 49047995-2b4f-4173-8bf8-ca47327159d1

   ┌─stock_name─┬───────date─┬─closing_price─┐
1. │ AAPL       │ 2024-11-25 │         150.5 │
2. │ AAPL       │ 2024-11-26 │           153 │
3. │ AAPL       │ 2024-11-27 │         151.5 │
4. │ AAPL       │ 2024-11-28 │           154 │
5. │ GOOG       │ 2024-11-25 │          2800 │
6. │ GOOG       │ 2024-11-26 │          2825 │
7. │ GOOG       │ 2024-11-27 │          2810 │
8. │ GOOG       │ 2024-11-28 │          2830 │
   └────────────┴────────────┴───────────────┘

8 rows in set. Elapsed: 0.002 sec.

clickhouse_node1 :) SELECT
    stock_name,
    date,
    closing_price,
    runningDifference(closing_price) AS daily_change
FROM stock_prices
ORDER BY
    stock_name ASC,
    date ASC

Query id: d84ead08-87fe-4388-94e9-619c001ac01a

   ┌─stock_name─┬───────date─┬─closing_price─┬─daily_change─┐
1. │ AAPL       │ 2024-11-25 │         150.5 │            0 │
2. │ AAPL       │ 2024-11-26 │           153 │          2.5 │
3. │ AAPL       │ 2024-11-27 │         151.5 │         -1.5 │
4. │ AAPL       │ 2024-11-28 │           154 │          2.5 │
5. │ GOOG       │ 2024-11-25 │          2800 │         2646 │
6. │ GOOG       │ 2024-11-26 │          2825 │           25 │
7. │ GOOG       │ 2024-11-27 │          2810 │          -15 │
8. │ GOOG       │ 2024-11-28 │          2830 │           20 │
   └────────────┴────────────┴───────────────┴──────────────┘

8 rows in set. Elapsed: 0.002 sec.
Explanation :
- runningDifference(closing_price):
- Computes the difference between each row and its preceding row for the closing_price column.
- For the first row of each stock, the difference is 0 (or undefined, depending on interpretation).
- Grouped by stock_name:
- The table is ordered by stock_name and date so that differences are calculated correctly for each stock.
Data Type-Specific Functions:
toStartOfYear
The toStartOfYear() function in ClickHouse simplifies working with dates by resetting a DateTime value to the very start of its year. It transforms any given date or time into January 1st at 00:00:00 of that year, making it easier to standardize and analyze yearly data trends.
Syntax:
toStartOfYear(date)
Let's calculate the total annual sales of a shop.
clickhouse_node1 :) SELECT
    toStartOfYear(date) AS year,
    sum(price) AS total_sale,
    bar(total_sale, 0, 100000, 100) AS graph
FROM product
GROUP BY year

Query id: 8deaff18-92c9-4c8c-a277-a3d7d630f5e7

   ┌───────year─┬─total_sale─┬─graph────────────────────────────────────┐
1. │ 2021-01-01 │      30800 │ ██████████████████████████████▊          │
2. │ 2022-01-01 │      22000 │ ██████████████████████                   │
3. │ 2023-01-01 │      39600 │ ███████████████████████████████████████▌ │
4. │ 2024-01-01 │      23900 │ ███████████████████████▉                 │
   └────────────┴────────────┴──────────────────────────────────────────┘

4 rows in set. Elapsed: 0.005 sec.
The query summarizes the shop's annual sales over four years, showing fluctuations in revenue.
addDays()
The addDays() function in ClickHouse is used to add a specified number of days to a given Date or DateTime value.
Syntax:
addDays(Date, n)
n - no. of days to be added
clickhouse_node1 :) SELECT
    order_date,
    product_id,
    destination,
    addDays(order_date, 5) AS estimated_delivery_time
FROM orders

Query id: 69aeab17-b1b6-4847-83cc-ddf62c548d9b

    ┌──────────order_date─┬─product_id─┬─destination───┬─estimated_delivery_time─┐
 1. │ 2024-11-01 10:00:00 │ P123       │ New York      │     2024-11-06 10:00:00 │
 2. │ 2024-11-02 14:30:00 │ P456       │ Los Angeles   │     2024-11-07 14:30:00 │
 3. │ 2024-11-03 09:15:00 │ P789       │ Chicago       │     2024-11-08 09:15:00 │
 4. │ 2024-11-04 11:45:00 │ P101       │ San Francisco │     2024-11-09 11:45:00 │
 5. │ 2024-11-05 16:00:00 │ P202       │ Houston       │     2024-11-10 16:00:00 │
 6. │ 2024-11-06 13:20:00 │ P303       │ Boston        │     2024-11-11 13:20:00 │
 7. │ 2024-11-07 08:00:00 │ P404       │ Dallas        │     2024-11-12 08:00:00 │
 8. │ 2024-11-08 17:30:00 │ P505       │ Seattle       │     2024-11-13 17:30:00 │
 9. │ 2024-11-09 12:00:00 │ P606       │ Miami         │     2024-11-14 12:00:00 │
10. │ 2024-11-10 15:45:00 │ P707       │ Denver        │     2024-11-15 15:45:00 │
    └─────────────────────┴────────────┴───────────────┴─────────────────────────┘

10 rows in set. Elapsed: 0.006 sec.
The query successfully calculates the estimated delivery time for each order by adding 5 days to the order_date. The resulting output shows that the estimated_delivery_time for each order is exactly 5 days after the order_date, which aligns with the intended functionality of the addDays() function.
timeDiff()
The timeDiff() function in ClickHouse calculates the difference between two DateTime values. This makes it highly flexible and useful for time-based analytics, such as calculating the time gap between events or analyzing the duration of processes.
Returns the difference between two date or dateTime in seconds
Syntax :
timeDiff(dateTime1, dateTime2)
clickhouse_node1 :) SELECT
    event_id,
    start_time,
    end_time,
    timeDiff(start_time, end_time) AS time_diff_in_seconds
FROM event_logs

Query id: bd58660f-0dc7-4ba7-91ac-f3f4ce00633c

    ┌─event_id─┬──────────start_time─┬────────────end_time─┬─time_diff_in_seconds─┐
 1. │        1 │ 2024-11-28 08:00:00 │ 2024-11-28 10:30:00 │                 9000 │
 2. │        2 │ 2024-11-28 09:15:00 │ 2024-11-28 11:45:00 │                 9000 │
 3. │        3 │ 2024-11-28 14:00:00 │ 2024-11-28 18:00:00 │                14400 │
 4. │        4 │ 2024-11-28 12:00:00 │ 2024-11-28 13:45:00 │                 6300 │
 5. │        5 │ 2024-11-28 07:30:00 │ 2024-11-28 10:00:00 │                 9000 │
 6. │        6 │ 2024-11-28 20:15:00 │ 2024-11-29 00:45:00 │                16200 │
 7. │        7 │ 2024-11-28 06:00:00 │ 2024-11-28 07:30:00 │                 5400 │
 8. │        8 │ 2024-11-28 16:30:00 │ 2024-11-28 19:00:00 │                 9000 │
 9. │        9 │ 2024-11-28 21:00:00 │ 2024-11-29 01:00:00 │                14400 │
10. │       10 │ 2024-11-28 23:45:00 │ 2024-11-29 03:15:00 │                12600 │
    └──────────┴─────────────────────┴─────────────────────┴──────────────────────┘

10 rows in set. Elapsed: 0.001 sec.
Aggregate Functions:
Quantile :
The quantile function is an aggregate function in ClickHouse used to calculate percentile values for a dataset. It identifies a value below which a certain percentage of observations in a group falls. For instance, the 0.5 quantile (50th percentile) is the median of the data.
Clickhouse_node1 :) SELECT
    server_id,
    quantile(0.5)(response_time_ms) AS median_response_time,
    quantile(0.9)(response_time_ms) AS p90_response_time,
    quantile(0.99)(response_time_ms) AS p99_response_time
FROM web_server_logs
GROUP BY server_id

Query id: 881778e5-19dd-4703-97d0-70a3662818c8

   ┌─server_id─┬─median_response_time─┬─p90_response_time─┬─p99_response_time─┐
1. │ server_1  │                  110 │               228 │             292.8 │
2. │ server_3  │                  220 │               252 │             259.2 │
3. │ server_2  │                   55 │                66 │ 69.60000000000001 │
   └───────────┴──────────────────────┴───────────────────┴───────────────────┘

3 rows in set. Elapsed: 0.645 sec.
Explanation:
- median_response_time: 50% of requests take this time or less.
- p90_response_time: 90% of requests take this time or less (indicates performance for most users).
- p99_response_time: 99% of requests take this time or less (indicates performance for almost all users).
Standard Deviation :
Standard deviation is a statistical measure that quantifies the amount of variation or dispersion in a dataset. A low standard deviation indicates that data points are close to the mean, whereas a high standard deviation suggests a wider spread of values.
In ClickHouse, stddevPop computes the population standard deviation, while stddevSamp computes the sample standard deviation.
stddevPop returns the square root of variance pop , and stddevSamp returns the square root of sample variance
Syntax:
- Population Standard Deviation (stddevPop):
stddevPop(column_name)
- Sample Standard Deviation (stddevSamp):
stddevSamp(column_name)
Let's see an example for stddev
clickhouse_node1 :) SELECT
    server_id,
    avg(response_time_ms) AS average_latency,
    stddevPop(response_time_ms) AS stddevPop_latency --population standard deviation
FROM server_latency
GROUP BY server_id

Query id: f64087f4-ed13-43f7-8c0d-0aa97777e8a9

   ┌─server_id─┬─average_latency─┬─stddev_latency─┐
1. │ server_1  │             114 │       20.59126 │
2. │ server_3  │             212 │       17.20465 │
3. │ server_2  │              60 │       7.071068 │
   └───────────┴─────────────────┴────────────────┘

3 rows in set. Elapsed: 0.031 sec.

Clickhouse_node1 :) SELECT
    server_id,
    avg(response_time_ms) AS average_latency,
    stddevSamp(response_time_ms) AS stddevSamp_latency --sample standard deviation
FROM server_latency
GROUP BY server_id


Query id: 5d5ff99d-11ed-486a-be8e-727afa240b5f


   ┌─server_id─┬─average_latency─┬─stddevSamp_latency─┐
1. │ server_1  │             114 │          23.021729 │
2. │ server_3  │             212 │          19.235384 │
3. │ server_2  │              60 │           7.905694 │
   └───────────┴─────────────────┴────────────────────┘


3 rows in set. Elapsed: 0.002 sec.
Aggregating function combinators
-If
The suffix -If can be appended to the name of any aggregate function. In this case, the aggregate function accepts an extra argument – a condition. The aggregate function processes only the rows that trigger the condition. If the condition was not triggered even once, it returns a default value (usually zeros or empty strings).
Clickhouse_node1 :)  SELECT *
FROM sales

Query id: e7691b8b-6f93-43bf-b500-cf2e3c50374f

   ┌───────date─┬─sales_amount─┐
1. │ 2023-10-01 │          100 │
2. │ 2023-10-02 │          150 │
3. │ 2023-10-03 │          120 │
4. │ 2023-10-04 │          180 │
   └────────────┴──────────────┘

4 rows in set. Elapsed: 0.019 sec.

Clickhouse_node1 :) SELECT sumIf(sales_amount, date > '2023-10-02') AS Total_sales
FROM sales

Query id: 9a008fbd-678a-43fd-9af9-6867b2a9cd1c

   ┌─Total_sales─┐
1. │         300 │
   └─────────────┘

1 row in set. Elapsed: 0.002 sec.
-Array
The -Array combinator modifies standard aggregate functions (like sum, avg, min, etc.) to accept arrays as input. Instead of calculating the aggregate over rows of data, it processes the elements within each array.
-If and -Array can be combined. However, ‘Array’ must come first, then ‘If’. Examples: uniqArrayIf(arr, cond),
Clickhouse_node1 :)  SELECT sumArray([100, 200, 150, 300, 400, 250]) AS total_sales

Query id: 00121da4-d23e-4afa-998b-be4a00b3ed7b

   ┌─total_sales─┐
1. │        1400 │
   └─────────────┘

1 row in set. Elapsed: 0.003 sec.
Full-Text Search:
match()
The match function in ClickHouse is used to perform regular expression matching against a string. It allows you to search for patterns within text data and is useful for tasks such as validation, extraction, and filtering.
Syntax :
match(string, pattern)
clickhouse_node1 :) SELECT *
FROM logs

Query id: 9c2d790d-60fc-4a58-8bea-fb11c91bd6b0

   ┌─id─┬─message────────────────────────────────┐
1. │  1 │ Error: file not found                  │
2. │  2 │ Warning: low disk space                │
3. │  3 │ Info: operation completed successfully │
   └────┴────────────────────────────────────────┘

3 rows in set. Elapsed: 0.036 sec.
clickhouse_node1 :) SELECT *
FROM logs
WHERE match(message, 'Error')

Query id: 24e2adef-a964-4ea4-a77d-610bfc7e90c2

   ┌─id─┬─message───────────────┐
1. │  1 │ Error: file not found │
   └────┴───────────────────────┘

1 row in set. Elapsed: 0.023 sec.
UUID Functions: generateUUIDv4 and generateUUIDv7 in ClickHouse:
generateUUIDv4()
The generateUUIDv4 function in ClickHouse is used to create a random UUID (Universally Unique Identifier) based on version 4 of the UUID standard. This version generates a UUID that is not based on any specific information, making it suitable for creating unique identifiers.
Syntax :
generateUUIDv4()
clickhouse_node1 :) CREATE TABLE uuid.salary
(
    `id` UUID DEFAULT generateUUIDv4(),
    `team` String,
    `player` String,
    `salary` UInt32,
    `position` String
)
ENGINE = Memory

clickhouse_node1 :) INSERT INTO salary (team, player, salary, position) VALUES
('Lakers', 'LeBron James', 45000000, 'Forward'),
('Warriors', 'Stephen Curry', 48000000, 'Guard'),
('Nets', 'Kevin Durant', 42000000, 'Forward'),
('Bucks', 'Giannis Antetokounmpo', 45000000, 'Forward'),
('Mavericks', 'Luka Doncic', 37000000, 'Guard');

clickhouse_node1 :) SELECT
    id,
    player
FROM salary

Query id: 90f9b017-1af8-4a5c-9495-0e51d0a9ed20

   ┌─id───────────────────────────────────┬─player────────────────┐
1. │ bc8e5596-e233-44ac-961b-cea3c04d2903 │ LeBron James          │
2. │ e67a1593-1dc7-4e7d-864f-7a0a344d09b6 │ Stephen Curry         │
3. │ 2bf0dbb3-544d-4923-808e-bd877ec5a407 │ Kevin Durant          │
4. │ 5c565b0b-0220-482d-90cd-017278bdac9d │ Giannis Antetokounmpo │
5. │ 0acaae19-1546-45f8-bde4-9d291ebe540e │ Luka Doncic           │
   └──────────────────────────────────────┴───────────────────────┘

5 rows in set. Elapsed: 0.004 sec. Visual Representation Functions
bar()
The bar() function in ClickHouse is used to generate a simple ASCII bar chart as a visual representation of data values in SQL query results. This function is useful for quickly seeing relative sizes and patterns in data directly in the query output, particularly when working with grouped or time-series data.
clickhouse_node1 :) SELECT *
FROM server_logs
LIMIT 5

Query id: f09fdcff-6aa3-4bfd-89fe-16e215a244fb

   ┌───────────timestamp─┬─server_id─┬─requests─┐
1. │ 2024-11-04 09:00:00 │ server-1  │     3200 │
2. │ 2024-11-04 09:00:00 │ server-4  │     2500 │
3. │ 2024-11-04 09:01:00 │ server-2  │     2800 │
4. │ 2024-11-04 09:01:00 │ server-5  │     2900 │
5. │ 2024-11-04 09:02:00 │ server-3  │     4500 │
   └─────────────────────┴───────────┴──────────┘
5 rows in set. Elapsed: 0.001 sec.

clickhouse_node1 :) SELECT
    server_id,
    sum(requests) AS total_requests,
    bar(total_requests, 0, 1000000, 1000) AS load_bar
FROM server_logs
GROUP BY server_id

Query id: 010f70f2-7b61-4171-80a2-af48e6b3644b

   ┌─server_id─┬─total_requests─┬─load_bar─────────────────────────┐
1. │ server-1  │          18400 │ ██████████████████▍              │
2. │ server-5  │          25800 │ █████████████████████████▊       │
3. │ server-4  │          31900 │ ███████████████████████████████▉ │
4. │ server-3  │          24600 │ ████████████████████████▌        │
5. │ server-2  │          16600 │ ████████████████▌                │
   └───────────┴────────────────┴──────────────────────────────────┘

5 rows in set. Elapsed: 0.003 sec.
User Defined Functions(UDF)
User Defined Functions (UDFs) in ClickHouse allow users to define custom functions using the SQL language (or sometimes in other programming languages) to extend ClickHouse’s capabilities beyond its built-in functions. This enables users to create reusable logic for complex calculations, transformations, or specific business requirements that are not covered by the default functions.
Syntax :
Create function function_name as (parameters,...) -> expression
clickhouse_node1 :) CREATE FUNCTION age_group AS (age) ->
    CASE
        WHEN age < 18 THEN 'Child'
        WHEN age >= 18 AND age < 60 THEN 'Adult'
        ELSE 'Senior'
    END;

Query id: d7e1fbeb-bd0b-4114-85d2-8cd29f0e500c

Ok.

clickhouse_node1 :) SELECT
    age,
    age_group(age) AS category
FROM
(
    SELECT arrayJoin([10, 25, 65]) AS age
)

Query id: 96fea7af-5007-49b8-9980-0b6d669f3daf

   ┌─age─┬─category─┐
1. │  10 │ Child    │
2. │  25 │ Adult    │
3. │  65 │ Senior   │
   └─────┴──────────┘

3 rows in set. Elapsed: 0.039 sec.
Executable User-Defined Functions :
ClickHouse can call any external executable program or script to process data.The configuration of executable user-defined functions can be located in one or more xml-files. The path to the configuration is specified in the user_defined_executable_functions_config parameter.
Creating a user defined function for masking sensitive data like number and email address.
Lets see how can we do this using
Masking_function.xml
<functions>
    <function>
        <name>mask_sensitive_data</name>
        <type>executable</type>
        <command>masking.py</command>
        <return_type>String</return_type>
        <argument>
            <type>String</type>
        </argument>
        <format>TSV</format>
    </function>
</functions>
Add the following configuration in config.xml
<user_defined_executable_functions_config> /masking_function.xml </user_defined_executable_functions_config>
Create a python file masking.py and save it in user_script folder
def mask_email(email):
    """Mask an email address by replacing characters in the local part."""
    try:
        local, domain = email.split("@")
        if len(local) > 1:
            masked_local = local[0] + "*" * (len(local) - 1)
        else:
            masked_local = "*"
        return f"{masked_local}@{domain}"
    except Exception:
        return "invalid_email"

def mask_phone(phone):
    """Mask a phone number by replacing all but the last two digits."""
    try:
        if len(phone) >= 2:
            return "*" * (len(phone) - 2) + phone[-2:]
        return "invalid_phone"
    except Exception:
        return "invalid_phone"
Lets execute through the query
clickhouse_node1 :) SELECT mask_sensitive_data('maks_email24@gmail.com') AS masked_email ;

Query id: c1470bdf-1061-477b-b02b-c44b47005175

   ┌─masked_email───────────┐
1. │ m***********@gmail.com │
   └────────────────────────┘

1 row in set. Elapsed: 0.480 sec.
This query demonstrates how a hypothetical function mask_sensitive_data processes an email by masking part of its characters for privacy. In the result, only the first character and the domain remain visible (m***********@gmail.com), effectively protecting sensitive user information while preserving its usability for identification or reporting.
Readable Formatting Functions
formatReadableSize
The formatReadableSize function converts a size in bytes into a human-readable string, such as KB, MB, GB, etc.
Syntax:
formatReadableSize(size_in_bytes)
Clickhouse_node1 :) SELECT
    database,
    name AS table_name,
    total_bytes AS size_in_bytes,
    formatReadableSize(total_bytes) AS readable_size
FROM system.tables
WHERE database = 'default'
ORDER BY total_bytes DESC

Query id: a06491e4-cc04-49c5-9ee2-8653dce53abf

   ┌─database─┬─table_name────┬─size_in_bytes─┬─readable_size─┐
1. │ default  │ orders        │           752 │ 752.00 B      │
2. │ default  │ user_activity │           611 │ 611.00 B      │
3. │ default  │ stock_prices  │           488 │ 488.00 B      │
4. │ default  │ sale          │           461 │ 461.00 B      │
5. │ default  │ logs          │           403 │ 403.00 B      │
6. │ default  │ users         │           369 │ 369.00 B      │
7. │ default  │ ck            │           337 │ 337.00 B      │
8. │ default  │ sales         │           333 │ 333.00 B      │
9. │ default  │ player_list   │             0 │ 0.00 B        │
   └──────────┴───────────────┴───────────────┴───────────────┘

9 rows in set. Elapsed: 0.002 sec.
formatReadableQuantity
The formatReadableQuantity function in ClickHouse converts a numeric value into a human-readable format. It is particularly useful for displaying large numbers (e.g., counts, sizes, etc.) in a compact and easy-to-understand way like thousands, millions, billions and so on.
Clickhouse_node1 :)SELECT
    arrayJoin([100, 12345, 432546534]) AS elapsed,
    formatReadableTimeDelta(elapsed) AS time_delta

Query id: bc85c349-41d1-4745-b791-8d539f3d413c

   ┌───elapsed─┬─time_delta──────────────────────────────────────────────────────┐
1. │       100 │ 1 minute and 40 seconds                                         │
2. │     12345 │ 3 hours, 25 minutes and 45 seconds                              │
3. │ 432546534 │ 13 years, 8 months, 17 days, 7 hours, 48 minutes and 54 seconds │
   └───────────┴─────────────────────────────────────────────────────────────────┘
formatReadableTimeDelta
The formatReadableTimeDelta function in ClickHouse converts a time interval (in seconds) into a human-readable duration. It is used to make elapsed times or durations easier to understand by displaying them in terms of days, hours, minutes, and seconds.
Clickhouse_node1 :)  SELECT
    arrayJoin([120, 12375, 432346534]) AS elapsed,
    formatReadableTimeDelta(elapsed) AS time_delta

Query id: a58953dd-33b1-45d1-9cec-77c4bd41d427

   ┌───elapsed─┬─time_delta─────────────────────────────────────────────┐
1. │       120 │ 2 minutes                                              │
2. │     12375 │ 3 hours, 26 minutes and 15 seconds                     │
3. │ 432346534 │ 13 years, 8 months, 15 days, 15 minutes and 34 seconds │
   └───────────┴────────────────────────────────────────────────────────┘

3 rows in set. Elapsed: 0.003 sec.
FAQ
In ClickHouse, the correct syntax is INTERVAL 60 DAY (singular DAY, not DAYS). You can use it to add or subtract days from any date or DateTime value. For example: SELECT now() + INTERVAL 60 DAY AS future_date; or in a WHERE clause: SELECT * FROM orders WHERE order_date >= now() - INTERVAL 60 DAY; This works with all date/time units: SECOND, MINUTE, HOUR, DAY, WEEK, MONTH, QUARTER, and YEAR.
Call generateUUIDv4() directly in a SELECT statement to get a random UUID: SELECT generateUUIDv4(); You can also use it as a default column value: CREATE TABLE my_table (id UUID DEFAULT generateUUIDv4(), name String) ENGINE = MergeTree() ORDER BY id; Each call produces a unique, random 128-bit UUID conforming to the version 4 specification.
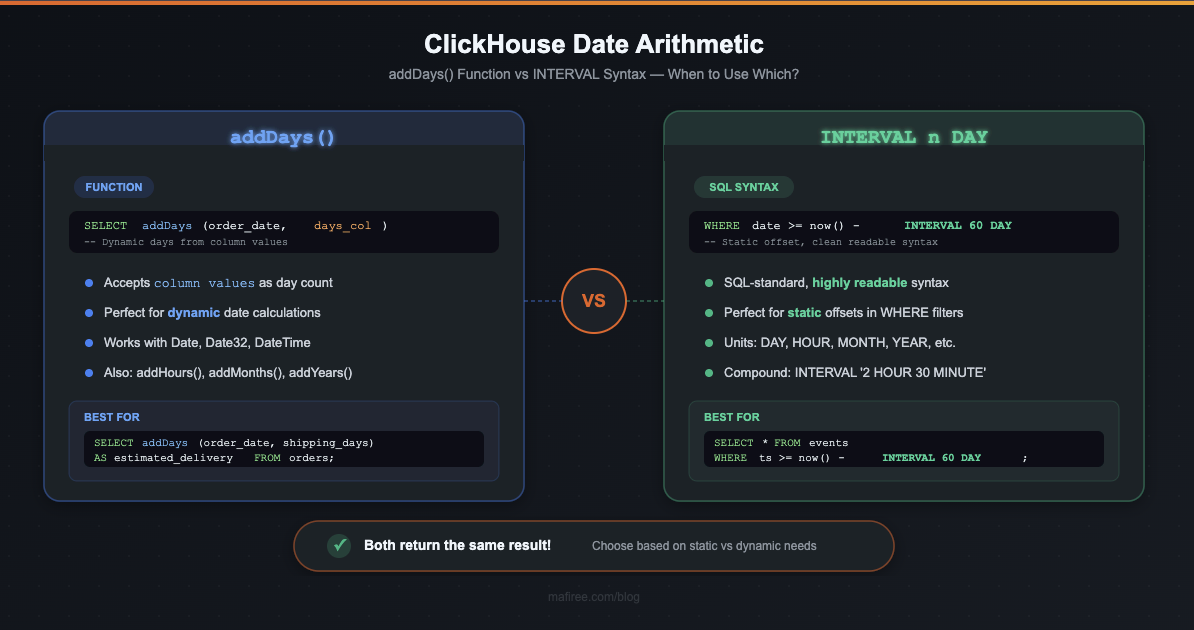
The addDays() function adds a specified number of days to a Date or DateTime value. The syntax is addDays(date, n), where n is the number of days to add. For example: SELECT addDays(toDate('2025-01-01'), 5) returns 2025-01-06. It's useful for calculating delivery dates, subscription expiry, trial periods, and other date-based deadlines.
Both achieve similar results but differ in syntax and flexibility. addDays(date, n) is a function that accepts a column or variable as n, making it ideal for dynamic day counts from table data. INTERVAL n DAY uses SQL-standard syntax and is more readable for static offsets, such as WHERE date >= now() - INTERVAL 60 DAY. Both return the same data type. Use addDays() for column-based arithmetic and INTERVAL for fixed offsets in filters and expressions.
Leave a Comment
Related Blogs


Subscribe for email updates
Get in touch with us
Highlights
More than 6000 Servers Monitored
Happy Clients
Certified DBAs
24 x 7 x 365 Support

Contacts


Nagercoil Office
Miru IT Park, Vallankumaranvillai,
Nagercoil, Tamilnadu - 629 002.
Bangalore Office
Unit 303, Vanguard Rise,
5th Main, Konena Agrahara,
Old Airport Road, Bangalore - 560 017.
Call: +91 6383016411
Email: sales@mafiree.com